
Keep the measurements. Reduce the water sent to drain.
Continuous water-quality monitoring does not have to mean a continuous analyzer drain. An approved direct Halogen MP5F installation measures free chlorine, pH, temperature, conductivity and ORP in the process water. Quantify avoided sample discharge and compare service tasks as you plan each monitoring point.
Plan My Water-Quality Monitoring ↗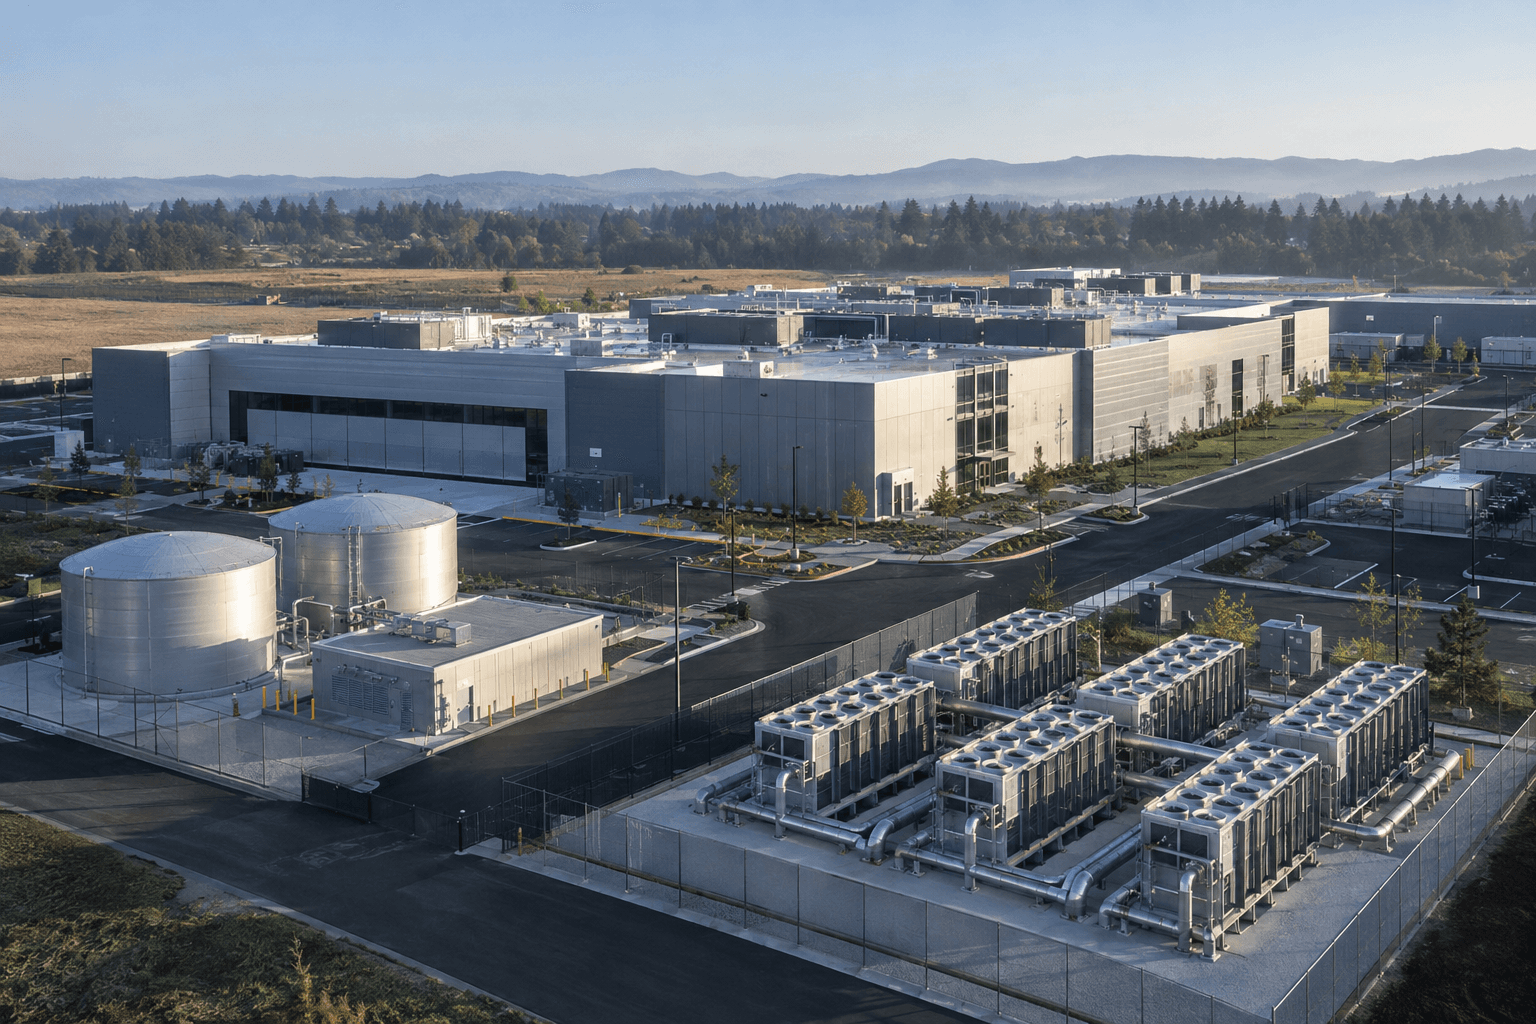
- Makeup waterEstablish incoming chemistry
- Storage / treatmentReview turnover and water quality
- Tower & recirculationSelect compatible monitoring points
- Controller & BMSSend measurements and status
Conceptual monitoring sequence. The controller receives data. Blowdown remains a separate process-water stream; potable water and server coolant require separate evaluation.
How much sample water could you avoid sending to drain?
Start with measured drain flow. The prefilled values are an illustrative example, not Halogen specifications or promised savings. Enter the proposed installation’s actual remaining drain flow. Include separately discharged carry-water and conditioning bypasses, counting each final drain once. Use a full-cycle average for intermittent drains; count a shared sample line once, even if it serves multiple sensors.
Estimated annual net reduction
262,800 liters
69,424 US gallons per year
Baseline drain: 262,800 L/year
Proposed drain + additional service water: 0 L/year
Formula: (current − proposed drain flow in L/min) × 60 × hours/day × days/year × points − additional proposed service liters/year.
Use separate calculations for points with different schedules or flow rates. Excludes water already returned to the process, cooling-tower blowdown, evaporation, tariffs and whole-site WUE. A negative result means the proposed arrangement uses more water within this boundary.
How carry-water flow changes the savings estimate →
Ask Halogen to review my assumptions →Connect water measurements to the systems your team uses.
Give each incoming-water, storage and cooling-loop point a clear identity. Trend free chlorine, pH, temperature, conductivity and ORP alongside dosing and equipment events so operators can compare locations and identify what changed. Include data freshness and available sensor status in the view.
Use the BMS/DCIM communications guide to compare the three layers, review D20 interface options and plan point mapping, alarms and communications-loss behavior.
A small drain at every point becomes a campus-wide demand
A sample stream of 0.5 L/min running continuously uses 262,800 liters per year. Across ten identical points, that is 2,628,000 liters before any remaining discharge or additional service water is deducted. Use this illustrative baseline to identify which analyzer drains are worth measuring first.
Trace the plumbing: does sample water stay in the system, return to it or go to drain? Direct MP5F mounting can remove the continuous sample-to-drain requirement at approved locations. A draining side stream still uses water even when the probe is reagent-free.
Where direct measurement may fit
| Candidate location | Measurement purpose | Water-use opportunity | Fit and confirmation |
|---|---|---|---|
| Makeup-water pipe | Incoming residual and context | Remove a dedicated continuously drained sample branch | MP5/MP-TOTAL by source chemistry; approved assembly and reference point |
| Tower recirculation line | Relevant treatment residual | Avoid analyzer sample discharge while retaining necessary blowdown | Chemistry/materials review, mixing, pressure, temperature and service access |
| Storage tank | Residual at the selected representative point | Compare approved immersion with a pumped sampling arrangement | Level, mixing, access and immersion configuration |
| Potable-water location | Program-selected residual | Assess analyzer discharge independently of required flushing | Certified wetted components, program requirements and approved operating limits |
| Remote mechanical yard | Useful local measurements and status | Identify both drain flow and avoidable visits | Suitable installation, power, telemetry and verification/service plan |
Blowdown should not be relabeled analyzer waste. If a monitoring point is added on a blowdown branch, it may help interpret discharge conditions but does not itself justify reducing discharge.
Specify five measurements and a practical service plan
The MP5F free chlorine sensor measures free chlorine, pH, temperature, conductivity and ORP. Its reagent-free, membrane-free design avoids reagent replenishment and membrane replacement; SensiCLENE mechanically cleans the electrodes. Internal circulation supports suitable low-bulk-flow installations.
Compare the complete point: chemistry and ranges, mounting and isolation, reference verification, inspection and parts service, controls mapping and drain/return routing. Review compatibility before selecting direct mounting. Explore MP5F.
Compare measurement approaches
This is a qualitative engineering comparison, not a ranking of every commercial model. The installation and manufacturer's procedure control actual water use and service requirements.
| Approach | Measurement pattern | Reagents/membranes | Sample-water implications | Work that remains |
|---|---|---|---|---|
| Manual grab sampling | Discrete readings when samples are collected | Depends on reference method; DPD uses reagent | Water taken per sample, not an inherent continuous drain | Collection, prompt analysis, quality checks and records |
| Online DPD colorimetric | Automated repeated analyses; cycle varies by model | DPD reagents; not a membrane sensing method | Common flowing-sample arrangements have discharge; quantify actual design | Reagent handling and model-specific fluidic/optical service and verification |
| Membrane amperometric | Online electrochemical measurement | Membrane and usually electrolyte; model-specific | Flow-cell or other arrangement governs water use; not universally sample-to-drain | Membrane/electrolyte tasks where applicable, cleaning and verification |
| Conventional bare-electrode | Online electrochemical measurement | No membrane by definition; conditioning/reagent requirements vary | Installation and flow-conditioning requirements vary | Electrode care, model-specific maintenance and verification |
| Halogen self-cleaning bare-electrode | Online measurement at the configured update cycle | No liquid reagents or membranes; mechanical cleaning | Suitable direct installation avoids continuous analyzer sample drainage; side streams must be assessed separately | Reference verification, inspections and prescribed parts/service |
Generic method descriptions are engineering summaries, not claims that all competitors share the same requirements. Confirm individual manuals during procurement; Hach's CL17sc resources illustrate one DPD analyzer family. No price, fixed maintenance interval, accuracy ranking or service-cost savings is asserted here.
Calculate avoided analyzer discharge
Build a measured baseline
Record drain flow for each operating state and the duration of that state. Include bypass flow if it is part of the analyzer sampling system. Avoid multiplying a momentary flow observation by an assumed full year when actual equipment operation is intermittent.
For constant flow: baseline liters = measured liters/minute × actual operating minutes. For varying flow: sum flow × duration across the recorded intervals. Net avoided analyzer water: baseline analyzer discharge − proposed analyzer discharge − additional sampling/service water attributable to the change.
Use comparable periods and note uncertainty. For multiple points, calculate each separately before summing. If water is returned, document the permitted destination and system boundary instead of counting it as discharged. Price estimates, if later requested, should use verified site tariffs and separately identified labor/consumables.
Relate the result to WUE carefully
Site water usage effectiveness is commonly expressed as site water use per IT equipment energy over a defined period. Report the boundary and period consistently; analyzer savings are only one possible contribution to the numerator. A change in cooling architecture or load can dominate the result. See DOE's data-center cooling-water guidance.
Install, integrate and verify the change
Select approved direct in-pipe, wet-tap, PVC-tee or immersion hardware where appropriate. A side-stream or flow-cell arrangement may still be the right engineering choice when access or operating conditions prevent direct installation. Confirm drain/return routing, complete-assembly ratings, safe removal and reference-sample access.
Connect the selected measurement/status points to the facility system through the approved controller configuration. Keep actual water accounting on appropriate meters or documented flow measurements; a chlorine sensor is not a makeup or blowdown flow meter. If remote reporting is desired, confirm the telemetry plan and export requirements.
Keep treatment and verification obligations intact
Water savings should not be obtained by removing required independent tests, inspections, cleaning or flushing. Compare maintenance through an actual work plan: tasks, service access, frequency determined by approved procedures, consumables, labor and reference checks. Retain the cooling-water or potable-water program appropriate to the location.
A lower analyzer drain volume does not establish Legionella control or regulatory compliance. Increasing tower cycles or reducing blowdown is a separate treatment decision. DOE's cooling-tower management guidance places tower water management in a broader operating context.
Engineering specification
Submit current analyzer/installation details, measured sample/bypass drain flow and operating hours, source/chemistry, analytes, operating envelope, candidate direct mounting, reference method, power and controls connection. Define how water and maintenance changes will be measured during a pilot. Request manufacturing-origin or project-specific BABA documentation if procurement requires it; do not assume blanket eligibility.
Where does the water go?
| Boundary | What to measure or document |
|---|---|
| Supply | Potable and alternative makeup volumes, source and reporting period |
| Cooling | Evaporation estimates, metered blowdown, drift assumptions and other losses |
| Instrumentation | Sample and bypass drains, returns, flushing and service water |
| Site reporting | Applicable total-site water quantity and IT energy for the same period |
Keep measured, estimated and calculated values distinguishable. Use the analyzer calculator for sample-drain losses and the blowdown guide for a separate treatment review.
How do you calculate water usage effectiveness?
For the site-based definition described by the U.S. Department of Energy, WUE equals annual site water usage in liters divided by IT equipment energy in kWh for the same year. State exactly what is included in the water numerator and use IT energy, not total facility electricity, as the denominator. DOE data-center water-efficiency guidance.
Keep withdrawal, consumption and discharge distinct in the supporting report. Document meter coverage and missing data. A lower WUE does not necessarily mean fewer total liters if IT activity increased; publish absolute volumes alongside the ratio. Comparisons also need context such as climate and cooling design.
Report savings that can be checked
- Define the physical boundary and baseline period before making a change.
- List meters, units, collection intervals and any estimates.
- Record weather, cooling mode, IT load, source changes and outages.
- Separate the forecast from the post-installation measurement.
- Avoid counting the same sample drain in both an analyzer and tower-discharge saving.
Download the water measurement and transparency checklist to organize evidence for internal review and community questions.
Answer community questions with clear boundaries
Explain where water comes from, which uses consume it, which return or discharge it, and how seasonal peaks differ from annual averages. Present alternative-source use separately from total water reduction. A reduction in potable supply is valuable, but it is not automatically a reduction in total consumption.
Include the reporting period, method, uncertainties and who can answer questions. Have local requirements reviewed for the specific jurisdiction; this checklist is an evidence organizer, not a permit application or a claim of compliance.
Plan for drought and supply interruptions
Define approved operating responses with the site engineer, supplier and treatment team before restrictions or supply changes occur. Identify alternative sources, required quality checks, storage assumptions and operating limits. Do not infer an exemption from local restrictions based on cooling technology or a sensor installation.
For a source switch, follow the reclaimed-water monitoring review and document the before-and-after chemistry.
Questions & answers
How can a data center reduce analyzer sample-water waste?
First measure the actual discharge from each analyzer sampling arrangement. Where chemistry, access and operating limits allow, a suitable direct-insertion sensor can remove the need for that continuous sample-to-drain stream. Account for remaining verification and service water, and keep the result separate from tower evaporation, required blowdown and other facility uses.
Is a reagentless analyzer automatically a zero-waste installation?
No. Reagentless describes the measurement chemistry, not the plumbing. A reagentless sensor in a continuously draining side stream can still discharge sample water. The installation must be reviewed separately. Describe the specific avoided stream, such as continuous analyzer sample-to-drain flow, rather than claiming the entire water system produces no waste.
Does direct chlorine monitoring eliminate cooling-tower blowdown?
No. Blowdown serves the cooling-water treatment and concentration-management strategy, while analyzer sampling is a separate stream. Removing an analyzer drain does not authorize a reduction in required blowdown. Any change to tower operating limits or discharge practice should be evaluated by the treatment designer and the responsible facility team.
Will replacing an analyzer improve water usage effectiveness?
It may reduce a measured water-use component if the replacement removes actual discharge within the reporting boundary. The effect on WUE depends on that volume, total site water use, IT energy and the comparison period. Calculate the contribution explicitly rather than promising a percentage improvement from the analyzer choice alone.
How much water will a direct installation save?
There is no universal number. Measure the current sampling and bypass drain flows and actual operating time, then compare the proposed arrangement over an equivalent period. Subtract remaining discharge and additional service or sampling water. A documented site calculation is more useful than applying a generic annual gallon claim to every installation.
Will self-cleaning eliminate maintenance costs?
No. Mechanical self-cleaning changes some service tasks but does not remove reference verification, inspection or manufacturer-prescribed service. Compare the proposed work plan with the current instrument using site labor, consumables and operating records. Do not assume that eliminating liquid reagents or membranes eliminates every maintenance activity or guarantees a fixed annual saving.
Plan your water-quality monitoring points.
Bring your water sources, cooling-loop layout and treatment program. We can help review five-parameter MP5F monitoring, low-maintenance installation options, sample-water savings and the data your operations team needs.
Follow the water through your facility.
Know your water. From incoming supply to every cooling loop.
Monitor free chlorine, pH, temperature, conductivity and ORP across data-center facility water. Explore low-maintenance sensing and analyzer water savings.
Understand the water in every cooling tower.
Use free chlorine, pH, temperature, conductivity and ORP trends to understand cooling-tower treatment, concentration and changing operating conditions.
Know the water entering your cooling system.
Establish incoming and tower-makeup baselines for free chlorine, pH, temperature, conductivity and ORP. Follow source, storage and blending changes.
Make water-quality changes visible to your water-management team.
Track residual, temperature and water-quality changes at data-center control points. Support a documented Legionella water-management response.
How much water could your monitoring points save?
Calculate annual sample-water savings from direct MP5F installation. Compare drain flow, operating hours and monitoring points, then download your estimate.
See what changes when your water source changes.
Monitor free chlorine, pH, temperature, conductivity and ORP when data-center water sources or blends change. Compare incoming and cooling-loop conditions.
Manage concentration with a clearer view of tower water.
Use MP5F conductivity, pH, temperature, free chlorine and ORP trends to support treatment-approved cooling-tower concentration and blowdown decisions.
Use five water-quality trends to find the next check.
Investigate changing residual with pH, temperature, conductivity and ORP. Compare supply and loop trends, verify samples and check BMS data.