See changes between visits
Identify declining disinfectant residual between scheduled grab samples.

 DRINKING WATER / DISTRIBUTION MONITORING
Track disinfectant residual and changing water conditions at critical points throughout your distribution system. Use the data to investigate low residuals, evaluate flushing and tank operation, and prioritize field response.
Calculate Sample-Water Savings ↓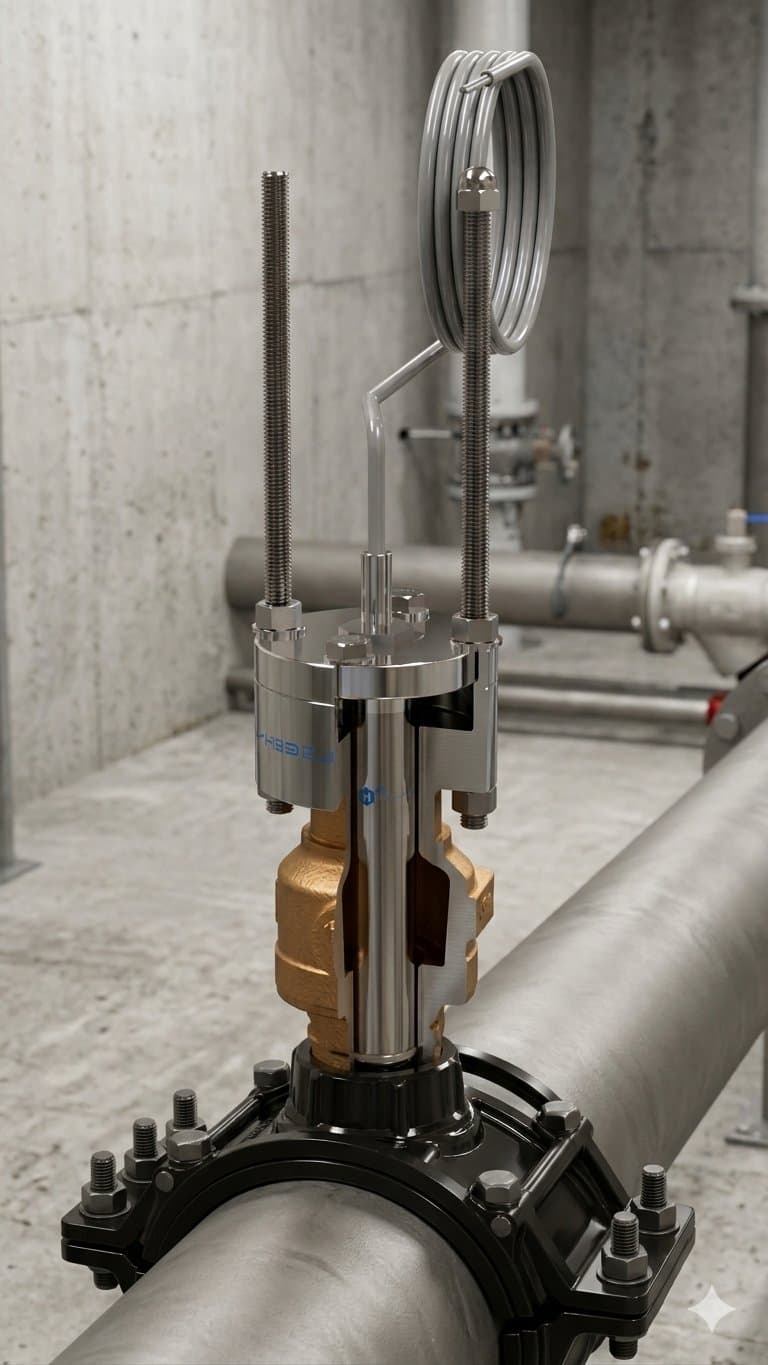
Water leaving the plant is the starting point. Distribution monitoring adds context as water moves through pipes and storage.
Identify declining disinfectant residual between scheduled grab samples.
Evaluate whether flushing restores residual at the monitoring point.
Compare water-quality trends with tank turnover and operating changes.
Monitor remote and historically troublesome locations.
Use multiple parameters supported by the selected model to investigate unusual changes.
Compare conditions before and after corrective actions.
Monitoring supports operational decisions. It does not itself correct water quality. Operators use the information alongside field checks, system knowledge and response procedures.
Monitor low-flow areas to identify when investigation or flushing may be needed. Confirm that the location represents the water you want to assess.
Explore dead-end monitoring.Compare residual and temperature trends with tank turnover. Choose representative sensor placement that accounts for mixing and changing water levels.
Review tank monitoring options.Select compatible power, communications and reporting intervals together. Review access, coverage and the energy budget before specifying hardware.
Find a remote monitoring configuration.Review total chlorine/monochloramine monitoring where supported by the selected product, with supporting water-quality measurements. Trends support investigation of chloramine degradation and possible nitrification; they do not confirm nitrification.
Discuss chloramine monitoring.Compare residual before, during and after flushing. Automatic flushing requires compatible controls and an engineered integration; a sensor package alone does not control flushing.
Evaluate my flushing application.Assess direct-in-pipe installation to eliminate continuous analyzer sample discharge where feasible. Start with your measured sample flow and operating schedule.
Estimate my water savings.Sensors measure conditions at their installation location. Placement should consider hydraulics, historical low residuals, water age and your operational goals.
Two scheduled grab samples capture conditions at those moments. Reveal the online trend to see a temporary residual dip that neither sample captures in this example.
The additional trend can prompt verification and investigation, and help operators compare changes with operating records. The curve shows recovery; it does not identify the cause or prove that a corrective action worked.
Illustrative data and sample schedule only. Online monitoring supports operational decisions; it does not automatically replace required grab samples, laboratory testing or verification procedures. No universal chlorine threshold is shown.
Follow incoming water as it exchanges with water already in storage. Select a sensor to see why its location changes the story—and why one reading may not represent the whole tank.
This point responds first to incoming water. A rising reading here does not establish the residual in the rest of the tank.
Water entering the tank has a different residual. The inlet sensor responds while the other locations still reflect water already in the tank.
Colors show relative residual differences in this illustration, not safe/unsafe levels. The example readings are animated snapshots, not a hydraulic simulation. Sensors measure their installation location; placement should consider inlet/outlet geometry, mixing, water level, historical conditions and the utility’s goals. Chlorine readings alone do not measure tank turnover or water age.
Review my tank monitoring installationFollow water from north to south. Lower-residual water travels between connected points while regional chlorine demand changes over time. Four sensor-informed controllers can flush independently—and simultaneously—as local conditions change.

Flushing increases water movement through the affected branch and its upstream supply. It does not instantly improve the reading: if upstream residual is still low, the valve remains open in this simplified example. Nearby connected sensors share water conditions, with differences caused by transport delay and regional decay.
No valve events yet. Play or advance the sequence to explore the response.
Higher residual Lower residual in this example. Pipe colors and sensor readings use the same water conditions. Colors do not establish safe/unsafe levels; low residual does not itself confirm contamination.
The demonstration assumes north-to-south flow on a fictional network over a Manhattan basemap. It is not an NYC hydraulic model or live utility data. Connected pipe sections pass water downstream; branching points share the same incoming residual. Smooth regional chlorine demand and moving supply pockets create related changes, rather than random sensor values. Storage mixing, pressure, actual travel times and real control design require site-specific engineering.
A specified sensor, compatible controls and an engineered valve integration can automate routine flushing and reduce trips just to operate a valve. Real installations require confirmation delays, valve feedback, maximum run times, alarms and fault handling. Operators still oversee the system, maintain equipment and follow required sampling procedures. This illustration does not replace those safeguards.
This separate short illustration explains one controller response. The interactive map above shows the connected network. No audio.
Lower-residual water reaches the sensor; a compatible controller opens the valve after confirmation; upstream water replaces it; the valve closes after recovery.
Assess a wet-tap or tee installation for mains and dead ends. Confirm the pipe, operating pressure, isolation and clearance needed for safe service.
Wet-tap installation data sheet ↗Consider immersion in tanks and reservoirs. Representative depth, mixing, changing water levels and service access matter.
Immersion installation data sheet ↗Assess pump-station piping or an existing sample line. An isolated or stale sample does not represent the main, even when the electrode operates independently of external flow.
Review mounting approaches ↗From pipe rooms to tank connections and vaults, these Halogen installation photos show how the sensing point, mounting hardware and nearby equipment fit together.
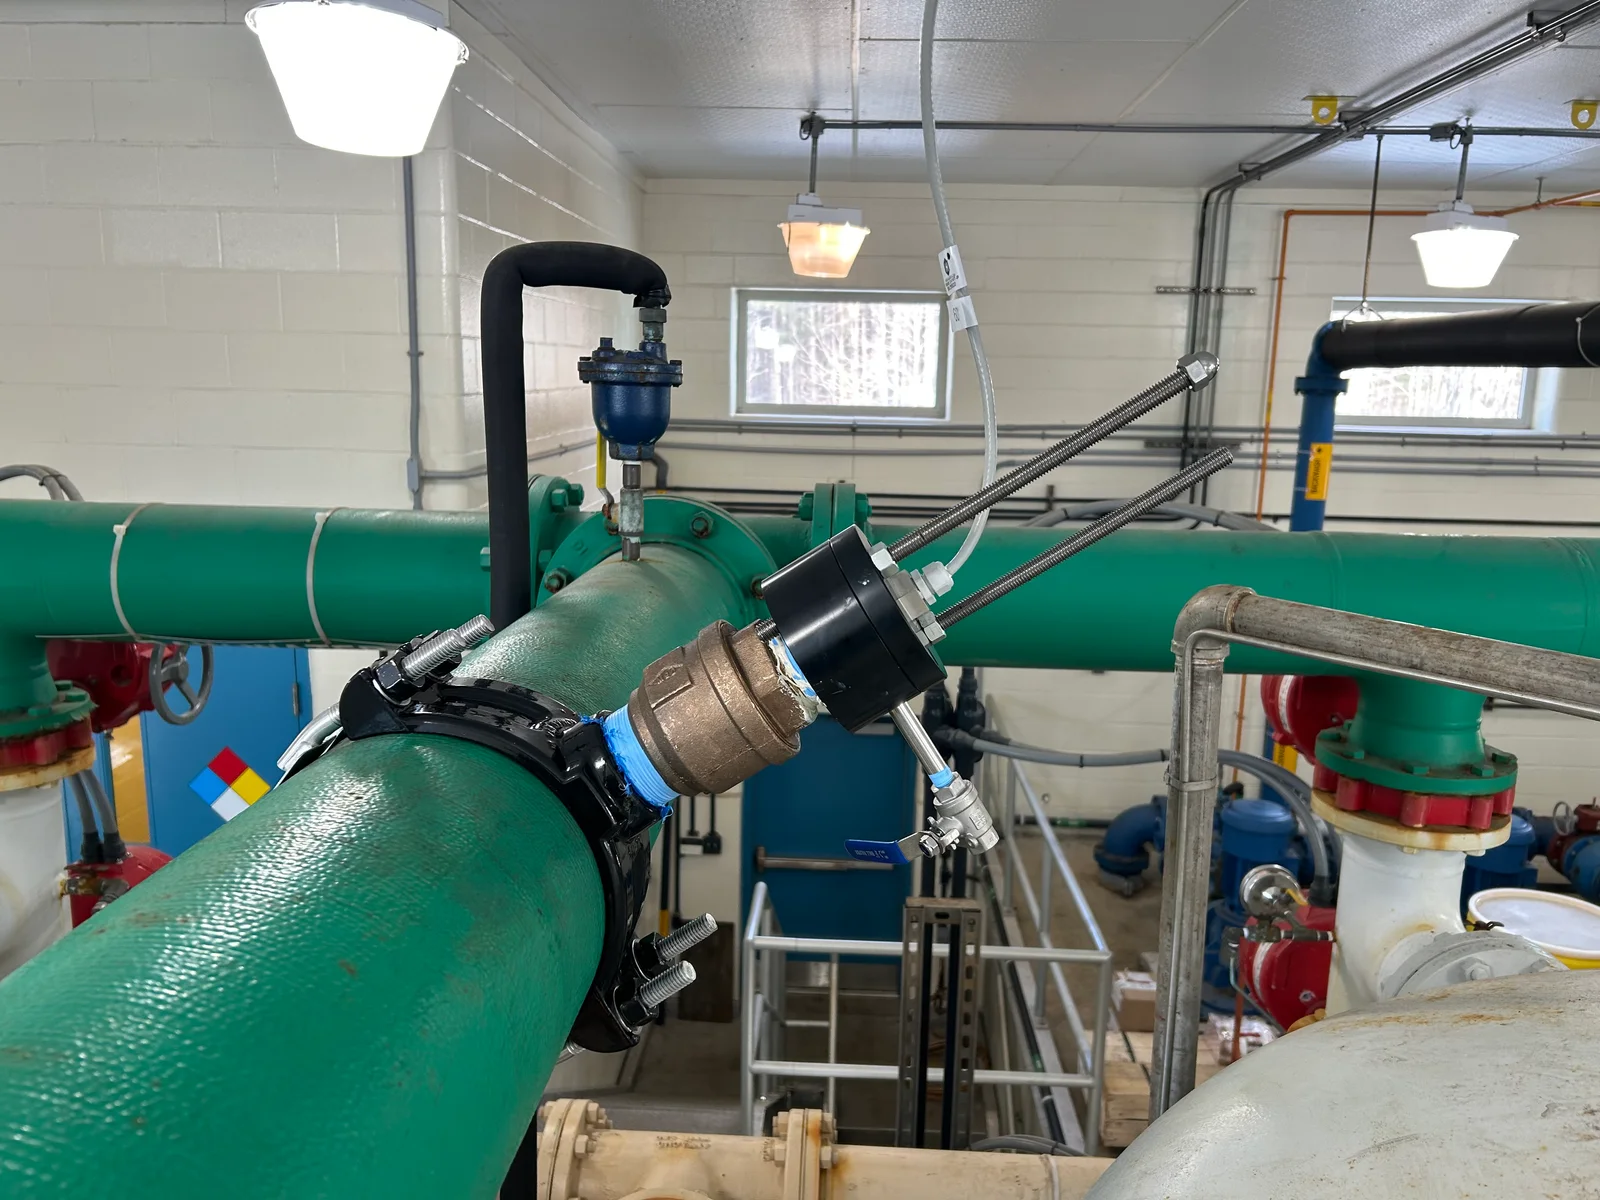 View full photo
The sensor mounts through a saddle and valve on the pipe. Pipe material, pressure and clearance guide the installation review.
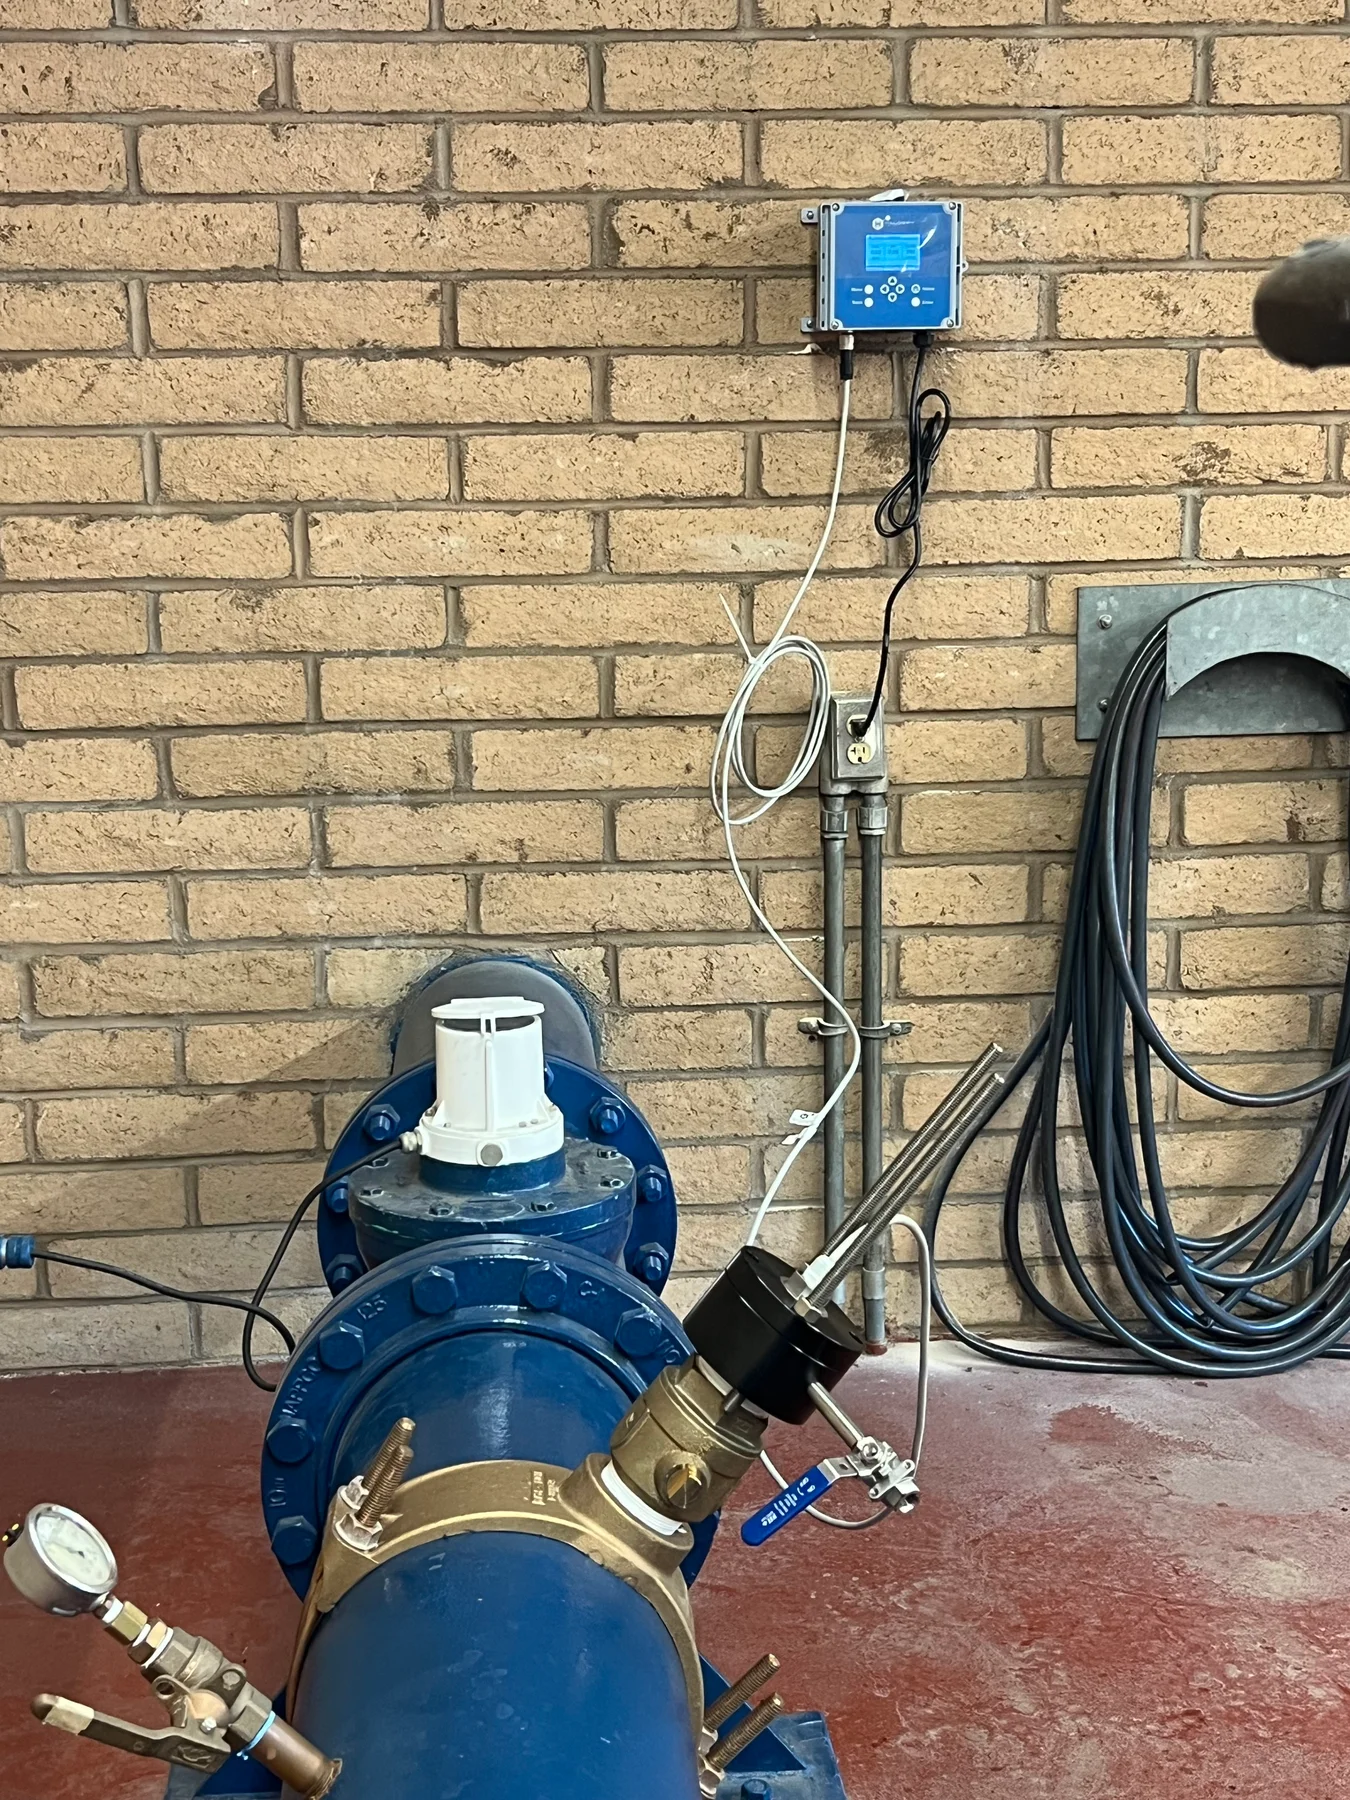 View full photo
The sensing point and display can occupy different positions. Plan cable routing, available power and convenient operator access.
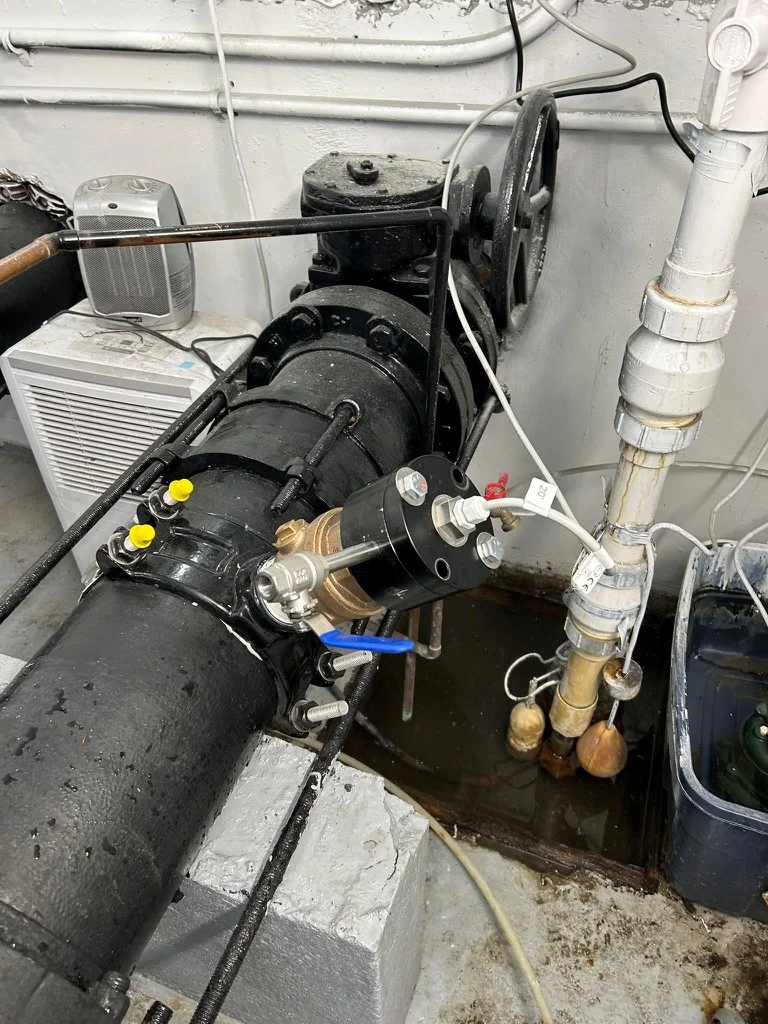 View full photo
An existing pipe room may offer a monitoring point. Check space around adjacent valves and plumbing, including room to remove the sensor.
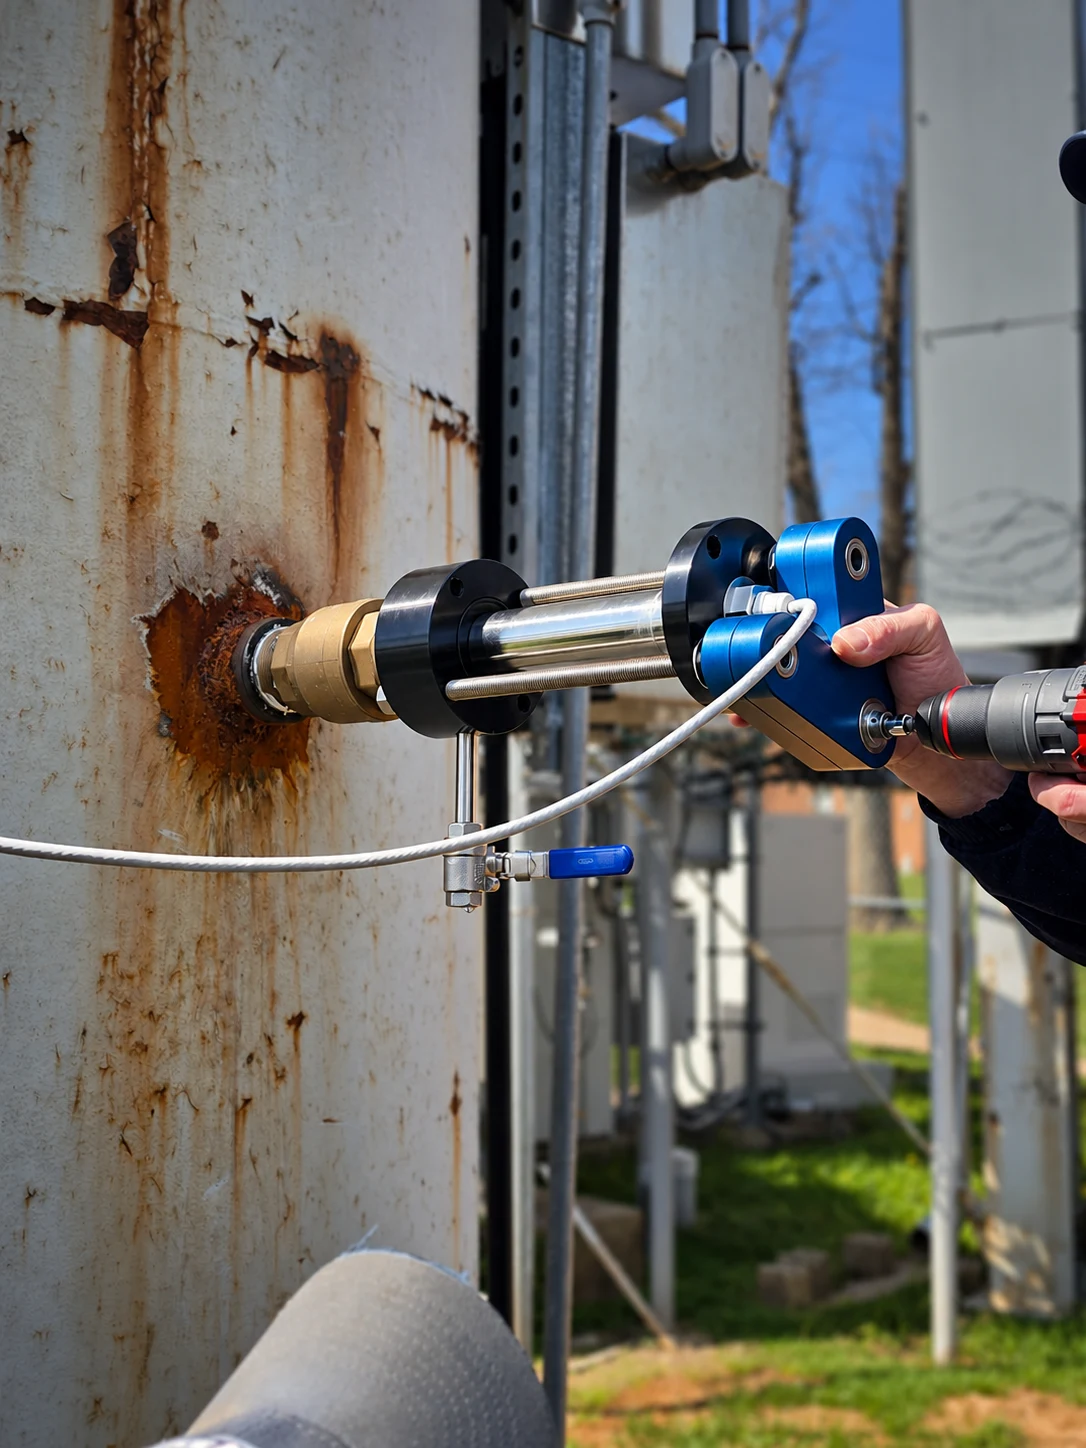 View full photo
This field photo shows access to the wet-tap assembly at a tank wall. Review mounting support and the working space needed for service.
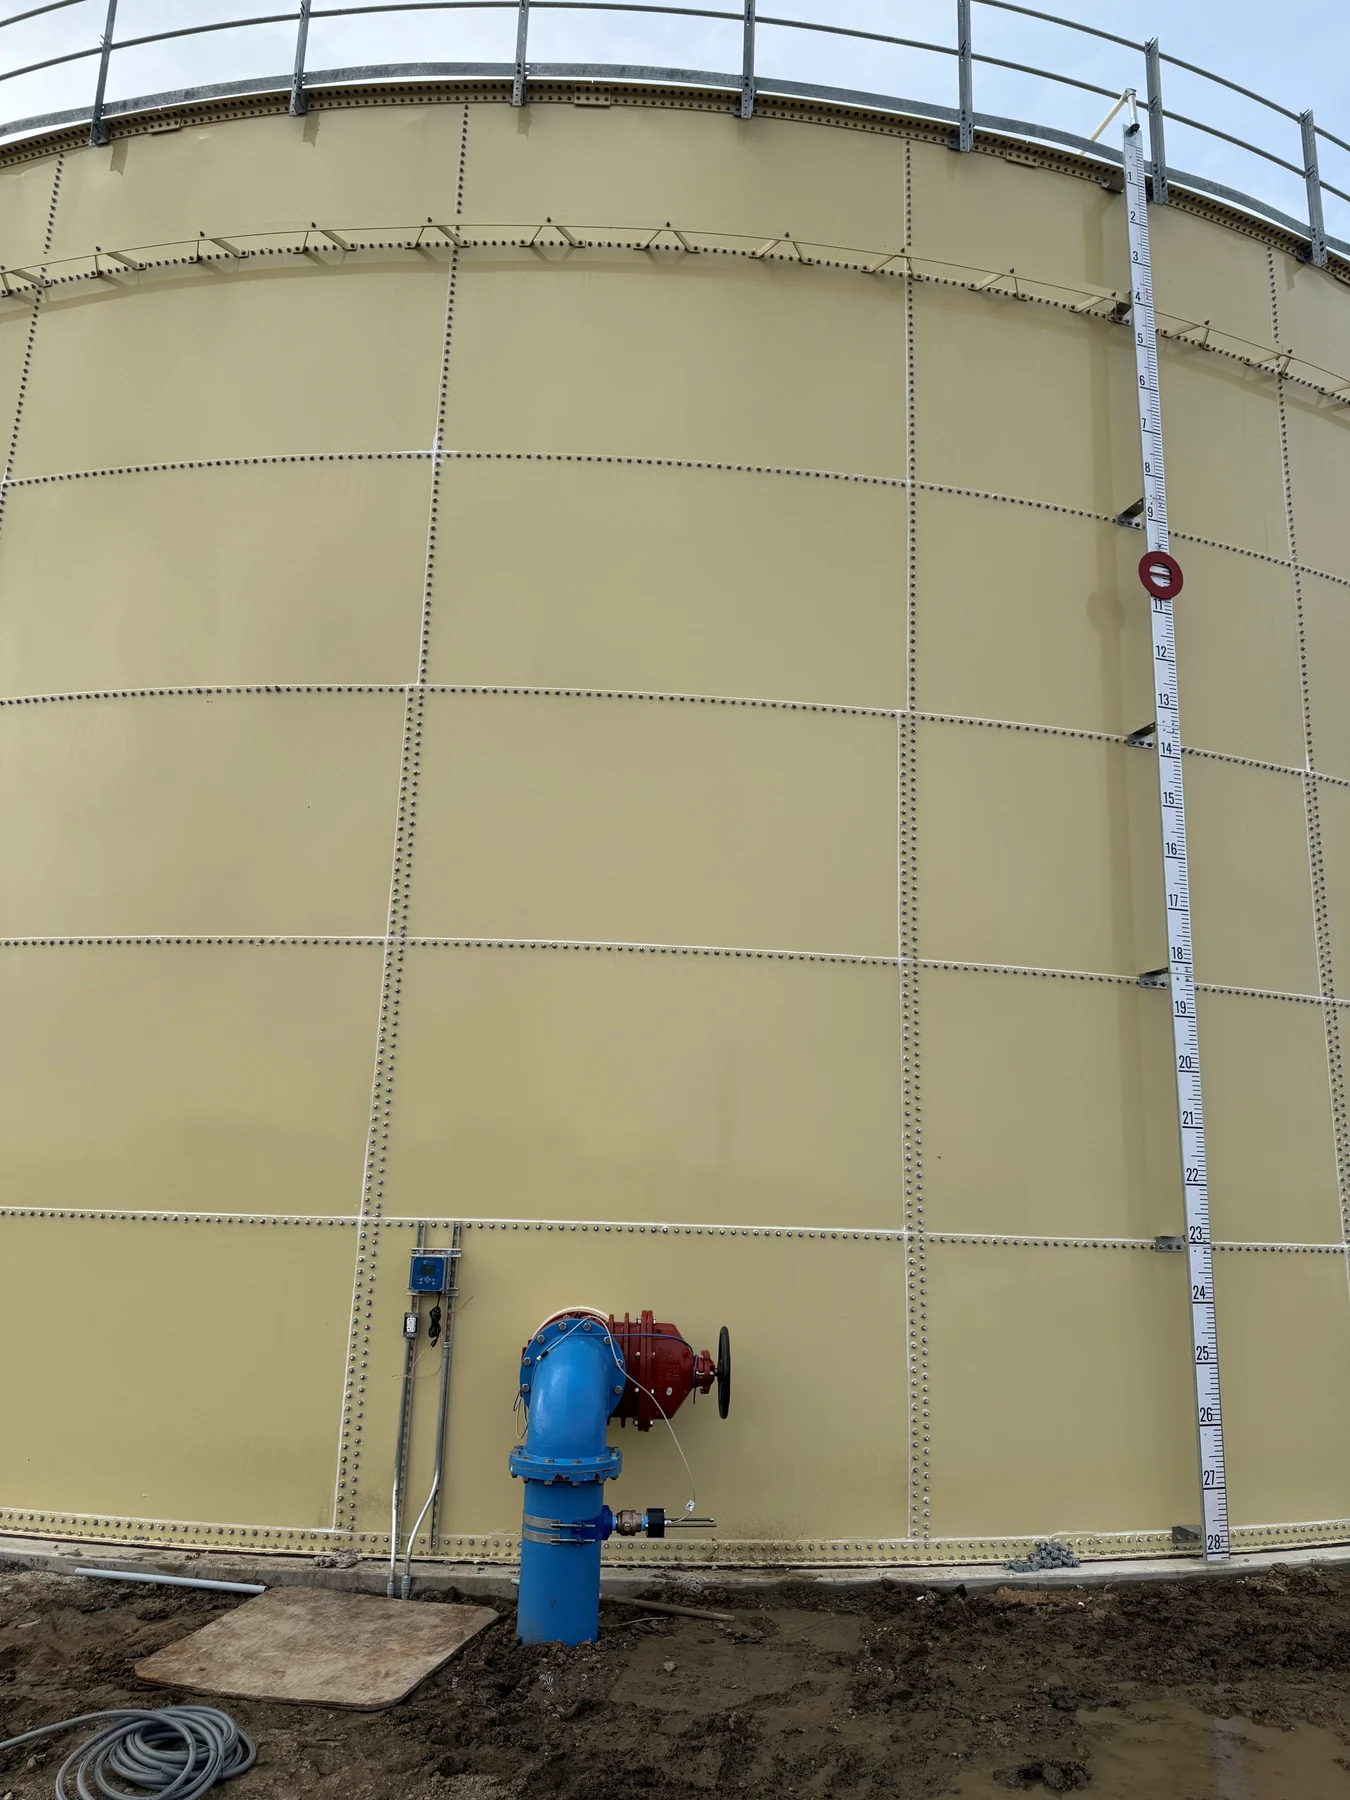 View full photo
Tank-connected piping can provide an accessible sensing point. Confirm how its readings relate to tank mixing, turnover and operating cycles.
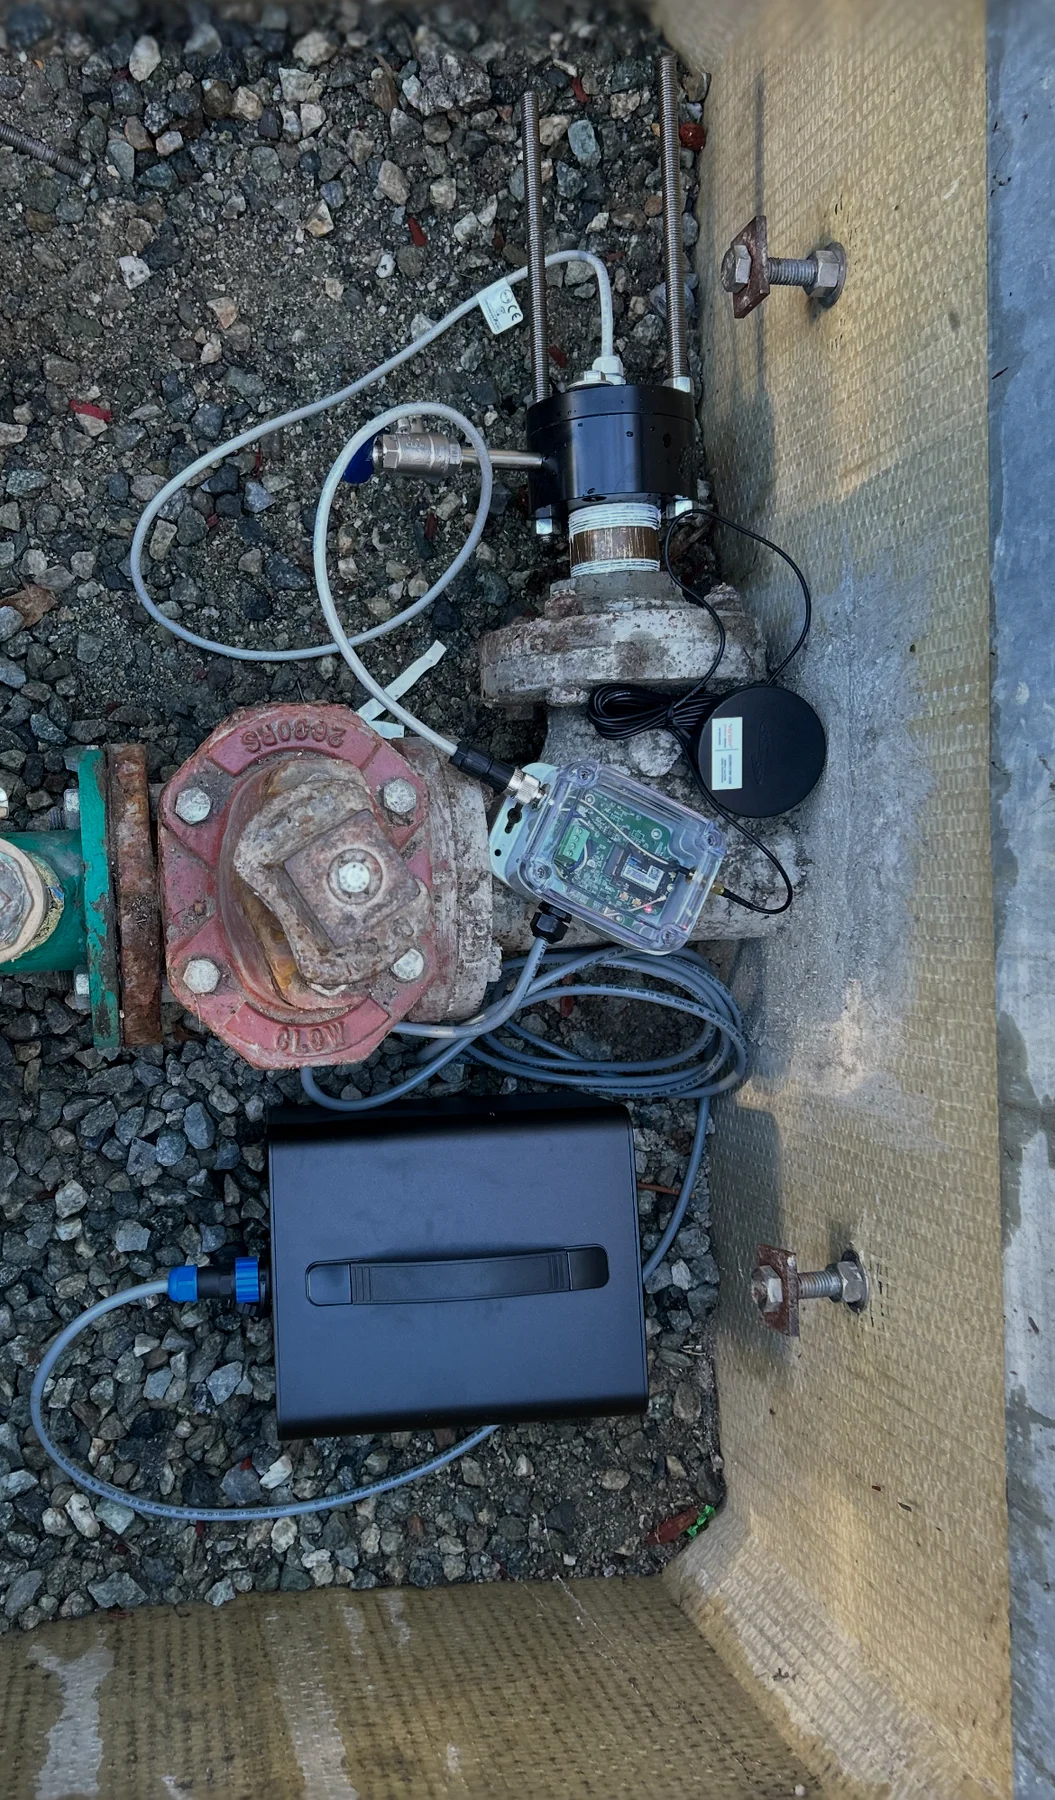 View full photo
Plan the sensing point and equipment location together. Review moisture protection, service access, power and communications for the selected hardware.
Field examples show different installations and hardware generations. Final placement, mounting and equipment selection need a site review.
Explore direct-in-pipe monitoring with the MP-TOTAL brochure. See the wet-tap assembly in cutaway, actual field installations and the seven water-quality parameters measured by one probe.
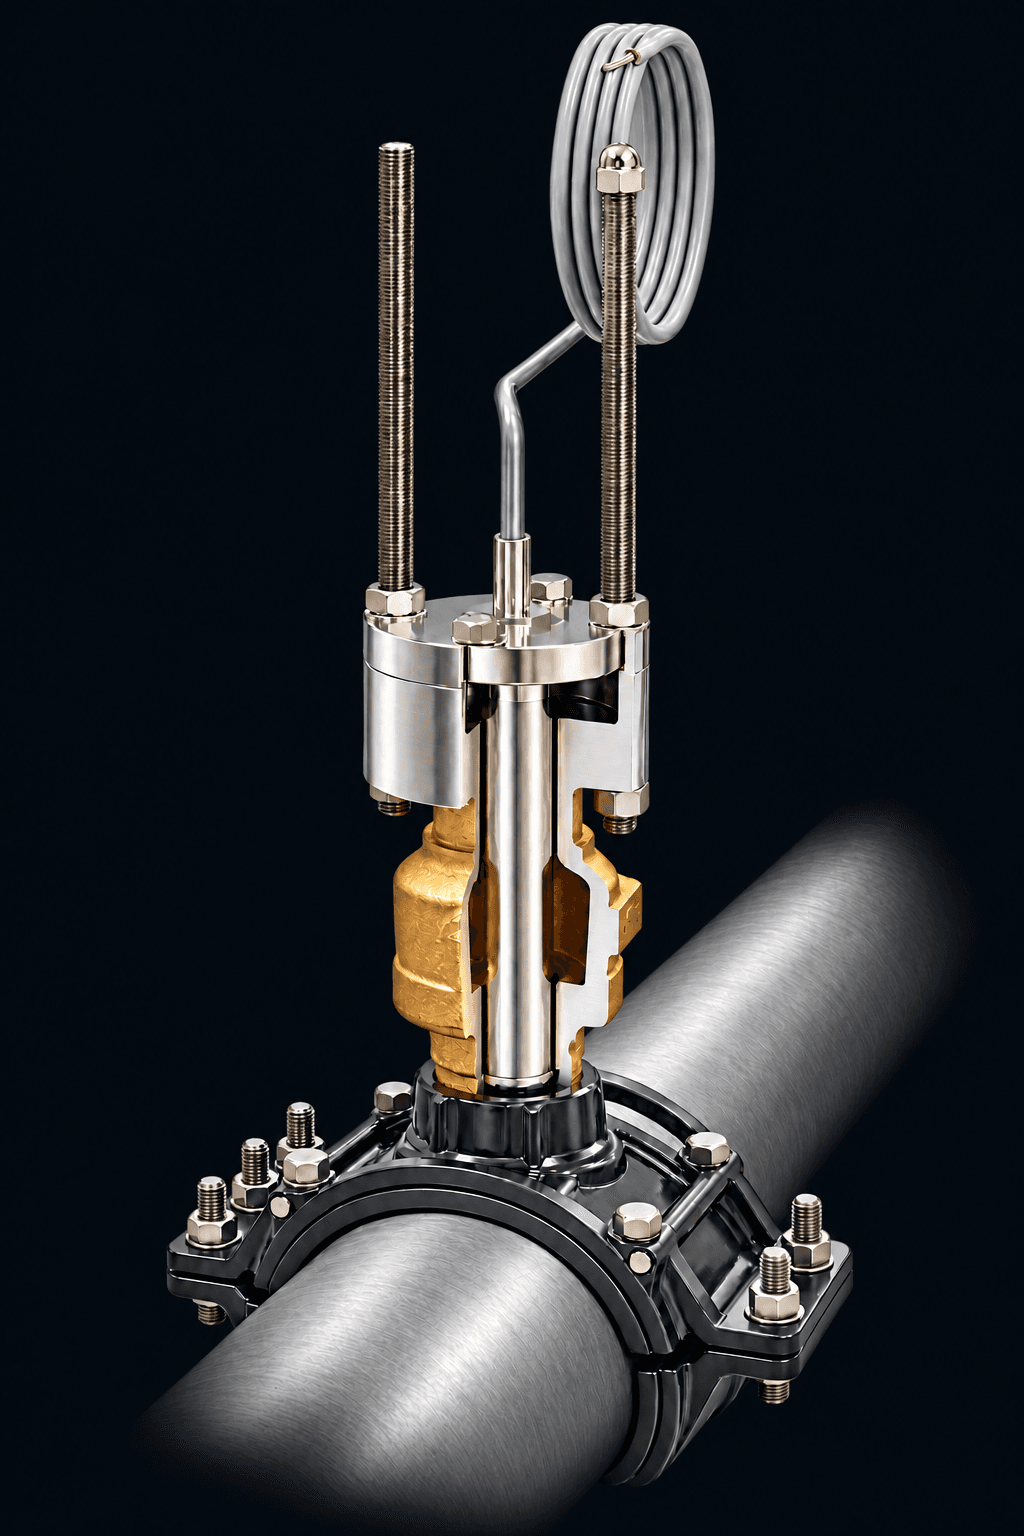
1 page. PDF download.
A quick product overview to share with your operations and engineering teams.
Complete the form to access the PDF immediately.
We use your details to process your download request. This form does not subscribe you to marketing emails. Privacy policy.
No contact information needed. Choose five answers for a preliminary installation plan.
Complete the five questions to see a sensor-family candidate, mounting approach and infrastructure considerations.
“Not sure” is a useful answer. Uncertain combinations go to an application review.
Tell us about your utility and monitoring objective. Your selector answers are included automatically; technical details are optional.
Halogen can review the measurement, mounting, power and communications together. Final hardware and availability need confirmation.
Review or change my selector answers ↑Need to talk through the site? 775.832.0495
Start with measured drain flow. The prefilled values are an illustrative example, not Halogen specifications or promised savings. Enter the proposed installation’s actual remaining drain flow. Include separately discharged carry-water and conditioning bypasses, counting each final drain once. Use a full-cycle average for intermittent drains; count a shared sample line once, even if it serves multiple sensors.
994,806 liters
262,800 US gallons per year
Baseline drain: 994,806 L/year
Proposed drain + additional service water: 0 L/year
Annual gallons = sample flow in gallons per minute × 60 × operating hours per day × operating days per year. The baseline is continuous analyzer sample discharge during those operating hours. Direct-in-pipe installation can eliminate that discharge where feasible; set proposed drain flow to zero only when the installation supports it.
Formula: (current − proposed drain flow in L/min) × 60 × hours/day × days/year × points − additional proposed service liters/year.
Use separate calculations for points with different schedules or flow rates. Analyzer sample water only. Potential flushing savings require site-specific before/after evidence and are not included. Excludes water already returned to the system and tariffs. A negative result means the proposed arrangement uses more water within this boundary.
How carry-water flow changes the savings estimate →
Ask Halogen to review my assumptions →Conditions can change as water moves through pipes and storage. Monitoring at selected points adds a record between field visits, helping operators investigate residual changes and compare operating decisions with measured conditions.
Halogen documentation describes an internal pump that moves water at the electrode for measurement in low or zero external flow. The sensor still measures the water at its location. Flow independence at the electrode does not make an isolated sample line representative of the distribution main.
Use system hydraulics, historical low residuals, water age estimates and operational goals. Consider mains, dead ends, tanks, booster stations and interconnections. Account for tank mixing, sample-line lag and maintenance access. These sensors do not directly measure water age.
Request a power review. Low-power sensor hardware and compatible communications availability must be confirmed before offering a battery or solar-supported configuration. Measurement frequency, reporting interval, climate and service access all affect the energy budget.
D20 documentation lists analog 4–20 mA outputs and RS485 Modbus RTU. Confirm the controller, sensor and interface configuration, point mapping, wiring and stale-data handling with your integrator. Other protocols and cellular options require configuration review.
Yes. Compare residual before, during and after flushing, alongside the flushing duration and water volume. Monitoring supports decisions; it does not itself correct water quality. Automatic flushing needs compatible controls and an engineered integration. Flushing savings require site-specific evidence.
No. A declining chlorine residual alone does not confirm nitrification. Investigation may include ammonia, nitrite/nitrate and other measurements, together with operating history and the utility’s procedures.
Not automatically. Follow applicable grab-sampling, laboratory-testing, calibration and verification procedures. NSF/ANSI 61 concerns drinking-water contact; it does not establish measurement accuracy or automatically authorize compliance reporting.
Start with your utility, contact details, location, objective and disinfectant. Pipe size/material, operating pressure, power, communications, accessible plumbing and drainage help refine the plan. For pump stations, include pump duty, any PRV and upstream/downstream access. Share what you know; engineering review can resolve the rest.
Halogen uses bare-electrode amperometric chlorine measurement. MP-5F is the current free-chlorine family name; earlier versions MP5 and MP5-A appear in older manuals. Confirm pH, temperature, conductivity and optional ORP against the selected model. MP-TOTAL documentation describes total chlorine and monochloramine; current availability requires review.
MP-5F free-chlorine family ↗MP-TOTAL application information ↗MP5A operation and maintenance manual ↗H2 identifies the mechanical sensor end; H3 identifies the circuit-board generation. Confirm the complete configuration before ordering.
General distribution-system and online-monitoring guidance for utility teams.
Drinking-water distribution system tools and resources ↗Online water-quality monitoring resources ↗Free resource
Excel + 1-page guide. About 30 minutes with your site list.
Get the free workbookFrom one trial to four booster stations: Whittier reports more than two years of MP5 experience, no calibrations since installation, and reagent-free chlorine monitoring that keeps operator visits short.
Read the Whittier success story →